Investigation 1: Understanding a Cladogram

Exercise 1: Chimpanzees and humans share 96% of their DNA which would place them closely on a cladogram. Humans and fruit flies are placed farther apart on a cladogram since they share only approximately 60% of their DNA.
Draw a cladogram that shows the evolutionary relationship between humans, chimpanzees, and fruit flies.

Exercise 2: Answer the following questions based on the cladogram shown.
Question 1: According to the cladogram, which organisms have hair?
According to the cladogram, the tiger and the gorilla are the only species that have hair.
Question 2: According to the cladogram, what four structures do tigers possess?
According to the cladogram, the tiger has jaws, lungs, dry skin as well as hair.
Question 3: According to the cladogram, which structure evolved first between lungs and dry skin?
According to the cladogram, lungs evolved before dry skin.
Investigation 2: Building Simple Cladograms
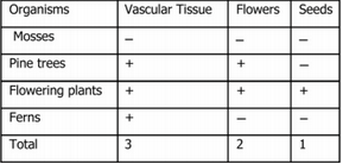
Exercise 3: Use the following data to build a cladogram of the major plant groups.
 |  |
Exercise 4: GAPDH is an enzyme that participates in glycolysis, an important reaction in cellular respiration. The table below shows the percentage of similarity of this gene and the protein it expresses in humans versus other species.
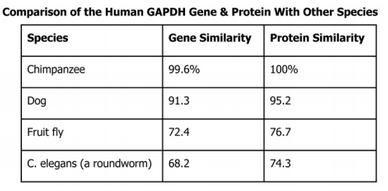 |  |
Why is the percentage of similarity in the protein always higher than the percentage of similarity in the gene for each of the species?
The percentage of similarity in the protein is always higher than the percentage of similarity in the gene for each species because there are less amino acids then there are codons. There are only 20 amino acids compared to that of 64 possible codon combinations.
The percentage of similarity in the protein is always higher than the percentage of similarity in the gene for each species because there are less amino acids then there are codons. There are only 20 amino acids compared to that of 64 possible codon combinations.
Investigation 3: Uncovering Fossil Specimen using BLAST
A. MORPHOLOGICAL OBSERVATION OF THE FOSSIL SPECIMEN AND FORMING THE HYPOTHESIS

A team of scientists have uncovered the following fossil specimen near Hells Creek, Montana.

Observations:
After observing the fossil of the unknown specimen, the physical structure or morphology consists of a long tail, four limbs, and a similarity to the structure of that of a lizard or other reptilian species. This can possibly mean the unknown specimen possesses a vertebrae.
Little is known about the fossil other than it appears to be a new species. Upon careful examination of the fossil, small amounts of soft tissue have been discovered. The scientists were able to extract proteins from the tissue and use the information to sequence several genes. Your task is to use BLAST to analyze these genes and determine the most likely placement of the fossil species on the following fossil cladogram shown.
Hypothesis:
If the morphological observations made are true and the specimen has limbs, a tail, and a vertebrae, then, the specimen should be placed near the crocodilians on the cladogram.
If the morphological observations made are true and the specimen has limbs, a tail, and a vertebrae, then, the specimen should be placed near the crocodilians on the cladogram.
4. Draw the hypothesis made onto the cladogram

B. USING BLAST TO ANALYZE GENES AND DETERMINE THE MOST LIKELY PLACEMENT OF THE FOSSIL SPECIES
Materials
Step 1: Instruction for Downloading Gene Files
Before starting this investigation, students need to download four gene files (Gene 1- Gene 4) to their flash drive or computer.
Step 2: Instructions for BLAST Queries
Upload the gene sequences into BLAST by following the instructions below:
Step 3: Instructions for Analyzing BLAST Queries
- Computer
- Internet Access
- Gene Files 1-4
- BLAST Website
Step 1: Instruction for Downloading Gene Files
Before starting this investigation, students need to download four gene files (Gene 1- Gene 4) to their flash drive or computer.
- These files are located at the following web address: http://blogging4biology.edublogs.org/2010/08/28/college-board-lab-fi les/
- Note that these files will not open on your computer. They only work when opened on the BLAST website.
Step 2: Instructions for BLAST Queries
Upload the gene sequences into BLAST by following the instructions below:
- Go to the BLAST homepage: http://blast.ncbi.nlm.nih.gov/Blast.cgi
- Click on “Saved Strategies” on the top of the page.
- Under “Upload Search Strategy,” click on “Browse” and locate one of the gene files you saved onto your computer.
- Click “View."
- A screen will appear with the parameters for your query already configured.
- NOTE: Do not alter any of the parameters.
- Scroll down the page and click on the “BLAST” button at the bottom.
- Repeat this step for the gene files 2, 3 and 4.
Step 3: Instructions for Analyzing BLAST Queries
- Scroll down to the section titled, “Sequences producing significant alignments”. The list of organisms that
appear below this section are those with sequences identical to or most similar to the gene of interest. The most similar sequences are listed first and as you move down the list, the sequences become less similar to your gene of interest. - Try clicking on a particular species listed to get a full report that includes the species’ classification scheme, the research journal the gene was first reported in, and the sequence of bases that appear to align with your gene of interest.
- Click “Distance tree of results,” a cladogram of the species with similar sequences to your gene of interest placed on the cladogram will be shown according to how closely their matched gene aligns with your gene of interest.


Step 4: Analysis of Results
Species share similar genes because of common ancestry. The more similar genes two species have in common, the more recent their common ancestor. Thus, the two species will be located closer on a cladogram. As you collect information from BLAST for each of the gene fi les explain whether the data supports your original hypothesis and your original placement of the fossil species on the cladogram. For each BLAST query, consider the following:
My analysis:
Gene 1 shares a common gene sequence with birds. Birds are located near the crocodiles on the cladogram, which is where I placed the unknown specimen. The gene of my interest has a 98% similarity with that of the gene sequence of the birds. Gene 2 shares common gene sequences with that of flies. Flies, or insects, branch off before crocodilians which is where my fossil is placed. Gene 2 only shares a 44% similarity with flies which corresponds with the cladogram because of when each species branches off. Gene 3 shows another common gene sequence with birds. Gene 4 has a 100% gene sequence similarity with that of an alligator.
Conclusion
Based on my analysis of my data, I can conclude that my hypothesis is correct and the unknown specimen would be near the crocodilians. I can make this argument because first, the gene sequence of Gene 4 has a 100% gene similarity with an alligator. Alligators are members of the Crocodilia family which means that they are crocodilians. This relation puts them closely near the crocodilians on the cladogram. Secondly, Gene 1 and 3 show the similarities between the unknown specimen and birds. The specimen showed a 98% and 95% match with species of birds which corresponds with the cladogram because birds branch off right before the crocodilians. Lastly, Gene 2 shows a 44% gene similarity which tells us that the specimen is not closely related to insects, which again, corresponds with the cladogram given.
Species share similar genes because of common ancestry. The more similar genes two species have in common, the more recent their common ancestor. Thus, the two species will be located closer on a cladogram. As you collect information from BLAST for each of the gene fi les explain whether the data supports your original hypothesis and your original placement of the fossil species on the cladogram. For each BLAST query, consider the following:
- What species has the most similar gene sequence as your gene of interest?
- Where is that species located on the cladogram?
- How similar is that gene sequence?
- What species has the least similar gene sequence as your gene interest?
My analysis:
Gene 1 shares a common gene sequence with birds. Birds are located near the crocodiles on the cladogram, which is where I placed the unknown specimen. The gene of my interest has a 98% similarity with that of the gene sequence of the birds. Gene 2 shares common gene sequences with that of flies. Flies, or insects, branch off before crocodilians which is where my fossil is placed. Gene 2 only shares a 44% similarity with flies which corresponds with the cladogram because of when each species branches off. Gene 3 shows another common gene sequence with birds. Gene 4 has a 100% gene sequence similarity with that of an alligator.
Conclusion
Based on my analysis of my data, I can conclude that my hypothesis is correct and the unknown specimen would be near the crocodilians. I can make this argument because first, the gene sequence of Gene 4 has a 100% gene similarity with an alligator. Alligators are members of the Crocodilia family which means that they are crocodilians. This relation puts them closely near the crocodilians on the cladogram. Secondly, Gene 1 and 3 show the similarities between the unknown specimen and birds. The specimen showed a 98% and 95% match with species of birds which corresponds with the cladogram because birds branch off right before the crocodilians. Lastly, Gene 2 shows a 44% gene similarity which tells us that the specimen is not closely related to insects, which again, corresponds with the cladogram given.

Investigation 4: BLAST Your Own Genes of Interest!
Materials
- Computer
- Internet Access
- Entrez Gene Website
- BLAST Website
- On the Entrez Gene website search the term “Catalase”.
- Click on the first link that appears and scroll down to “NCBI Reference Sequences”.
- Click on the first file name “NM_001036714.5" under “mRNA and Proteins”.
- Click on “FASTA” just below the gene title.
- The nucleotide sequence displayed is that of the gene in humans.
- Copy the gene sequence and go to the BLAST homepage (http://blast.ncbi.nlm.nih.gov/Blast.cgi).
- Click on “nucleotide blast” under the Basic BLAST menu.
- Paste the sequence into the box where it says “Enter Query Sequence.”
- Give the query a title in the box provided if you plan on saving it for later.
- Under “Choose Search Set” select the type or genome you want to search (human genome, mouse genome, or all genomes available).
- Under “Program Selection” choose whether or not you want highly similar sequences or somewhat similar sequences. Choosing somewhat similar sequences will provide you with more results.
- Click BLAST.
In humans, what is the importance of the gene you chose? Would you expect to find that gene is all organisms? Why or why not?
Catalase is important to humans because it protects cells from oxidative damage. I would expect to find this in all organisms because most living organisms are exposed to oxygen.
Catalase is important to humans because it protects cells from oxidative damage. I would expect to find this in all organisms because most living organisms are exposed to oxygen.
Gene: Catalase
Hypothesis:
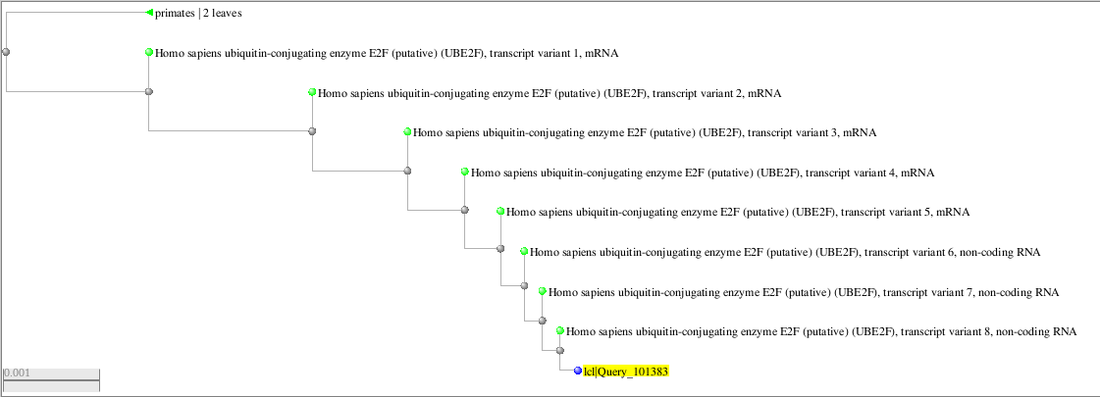
If catalase is an essential element in protecting cells from oxidative damage in humans, then, this important enzyme should also be present in the cells of primates.
Hypothesis:
If catalase is an essential element in protecting cells from oxidative damage in humans, then, this important enzyme should also be present in the cells of primates.
My Analysis:
Catalase is an enzyme found in almost all organisms that are exposed to oxygen which helps protect from oxidative damage. Primates and humans are both organisms that are exposed to oxygen, therefore, both species should possess this trait. This is proven in my data because it shows that both species have this enzyme.
Catalase is an enzyme found in almost all organisms that are exposed to oxygen which helps protect from oxidative damage. Primates and humans are both organisms that are exposed to oxygen, therefore, both species should possess this trait. This is proven in my data because it shows that both species have this enzyme.
Conclusion:
Based on my analysis of my data, I can conclude and prove that Catalase is present in both humans and primates. The cladogram taken from the BLAST website was able to give me this information to prove my statement. In all, my experiments and results supported my hypotheses. During this lab, some errors that might have occurred could have been misunderstanding the cladograms, however, the newly information I learned throughout this process decreased the chances of that happening. The entirety of this lab helped me to better understand cladograms and their importance!
Based on my analysis of my data, I can conclude and prove that Catalase is present in both humans and primates. The cladogram taken from the BLAST website was able to give me this information to prove my statement. In all, my experiments and results supported my hypotheses. During this lab, some errors that might have occurred could have been misunderstanding the cladograms, however, the newly information I learned throughout this process decreased the chances of that happening. The entirety of this lab helped me to better understand cladograms and their importance!
